Bike Sales: From Three Tables to a Revenue Trend
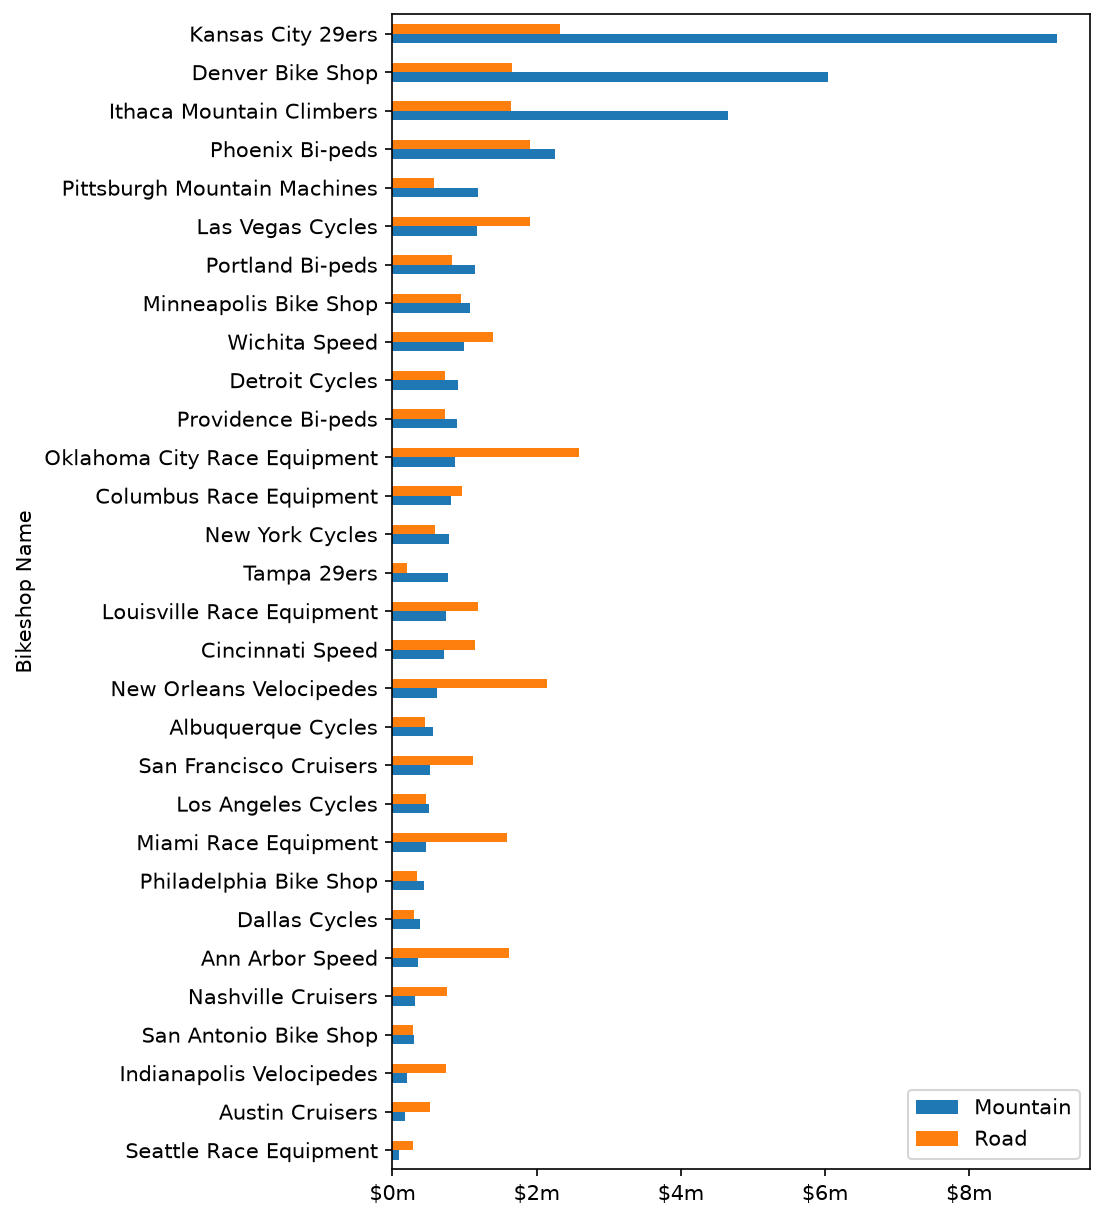
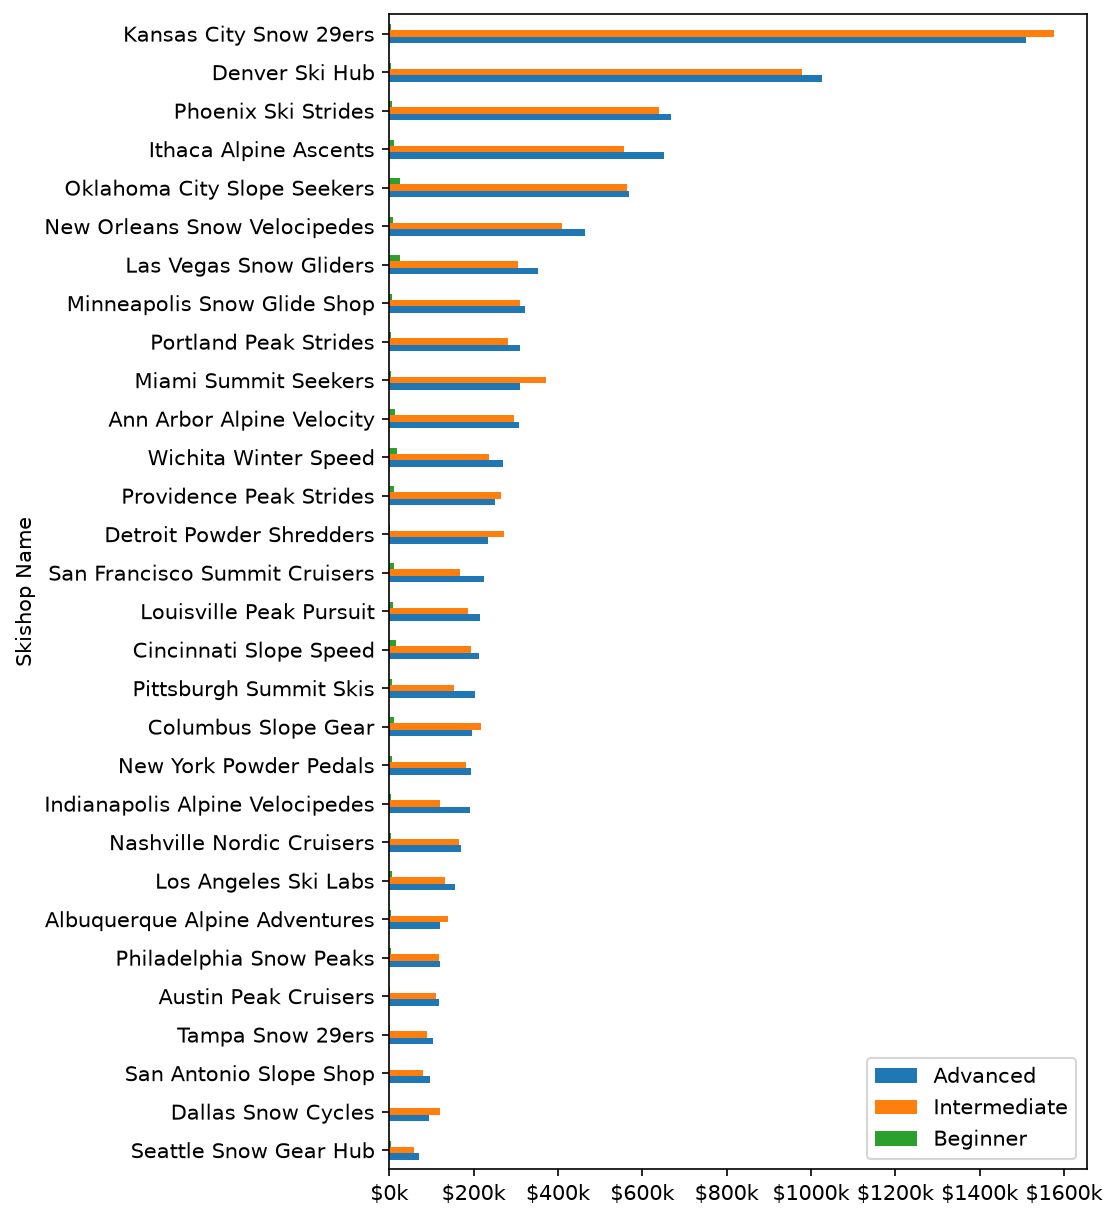
Joins 15,644 order lines to 97 bike models and 30 shops, splits product and location text into usable columns, and rolls revenue up by month and by week for each sub-category.
15,644order lines joined
9sub-categories tracked weekly
Code · 110 lines
# Bike sales pipeline: join three tables, clean text fields, build revenue,
# then roll orders up to monthly and weekly revenue trends.
# Data: bikes.xlsx, bikeshops.xlsx, orderlines.xlsx (15,644 order lines, 97 bikes, 30 shops)

import pandas as pd
import numpy as np
import matplotlib.pyplot as plt
from mizani.formatters import currency_format
from plotnine import (
    ggplot, aes,
    geom_line, geom_smooth,
    scale_y_continuous,
    labs, theme_minimal, expand_limits,
)

# 1.0 Read the three source tables
bikes_df = pd.read_excel("bikes.xlsx")
bikeshop_df = pd.read_excel("bikeshops.xlsx")
orderlines_df = pd.read_excel("orderlines.xlsx")

# 2.0 Quick look: five best-selling bike descriptions
top5_bike_series = bikes_df['description'].value_counts().nlargest(5)
top5_bike_series.plot(kind="barh", color="black")
plt.show()

# 3.0 Join order lines to products and shops in one method chain
bike_orderlines_joined_df = orderlines_df \
    .drop(columns='Unnamed: 0') \
    .merge(
        right=bikes_df,
        how='left',
        left_on='product.id',
        right_on='bike.id'
    ) \
    .merge(
        right=bikeshop_df,
        how='left',
        left_on='customer.id',
        right_on='bikeshop.id'
    )

# 4.0 Split compound text fields into their own columns
df = bike_orderlines_joined_df.copy()

# "Road - Elite Road - Carbon" -> category, sub-category, material
temp_df = df['description'].str.split(" - ", expand=True)
df['Category_1'] = temp_df[0]
df['Category_2'] = temp_df[1]
df['Material'] = temp_df[2]

# "Ithaca, NY" -> city, state
temp_df = df['location'].str.split(", ", expand=True)
df['City'] = temp_df[0]
df['State'] = temp_df[1]

# 5.0 Extended price, then keep only the columns the analysis needs
df['total_revenue'] = df['price'] * df['quantity']
df.sort_values('total_revenue', ascending=False).head(10)

cols_to_keep_list = [
    'order.id', 'order.line', 'order.date', 'quantity',
    'bike.id', 'model', 'description', 'price',
    'bikeshop.id', 'bikeshop.name', 'location',
    'Category_1', 'Category_2', 'Material', 'City',
    'total_revenue',
]
df = df[cols_to_keep_list].copy()

# Dots in column names break attribute access, so swap them for underscores
df.columns = df.columns.str.replace(".", "_")

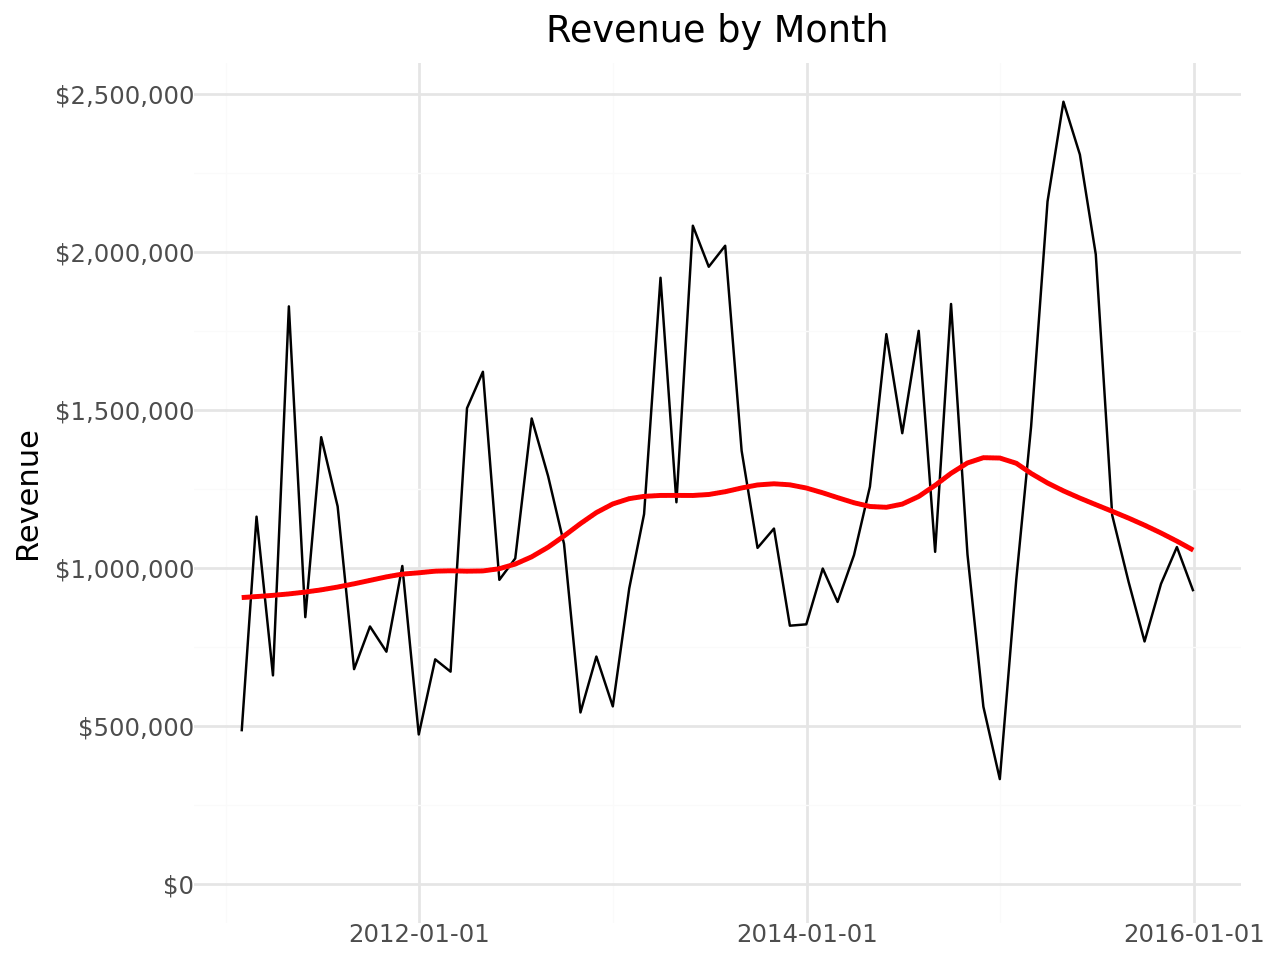
# 6.0 Monthly revenue trend
# Time series order of operations:
#   set the date column as the index -> group -> resample -> aggregate
sales_month_df = df[["order_date", "total_revenue"]] \
    .set_index("order_date") \
    .resample(rule="MS") \
    .aggregate(np.sum) \
    .reset_index()

usd = currency_format(prefix="$", precision=0, big_mark=",")

(
    ggplot(data=sales_month_df, mapping=aes(x="order_date", y="total_revenue"))
    + geom_line()
    + geom_smooth(method='lowess', color='red', span=0.4, se=True)
    + scale_y_continuous(labels=usd)
    + labs(title='Revenue by Month', x='', y='Revenue')
    + theme_minimal()
    + expand_limits(y=10)
)

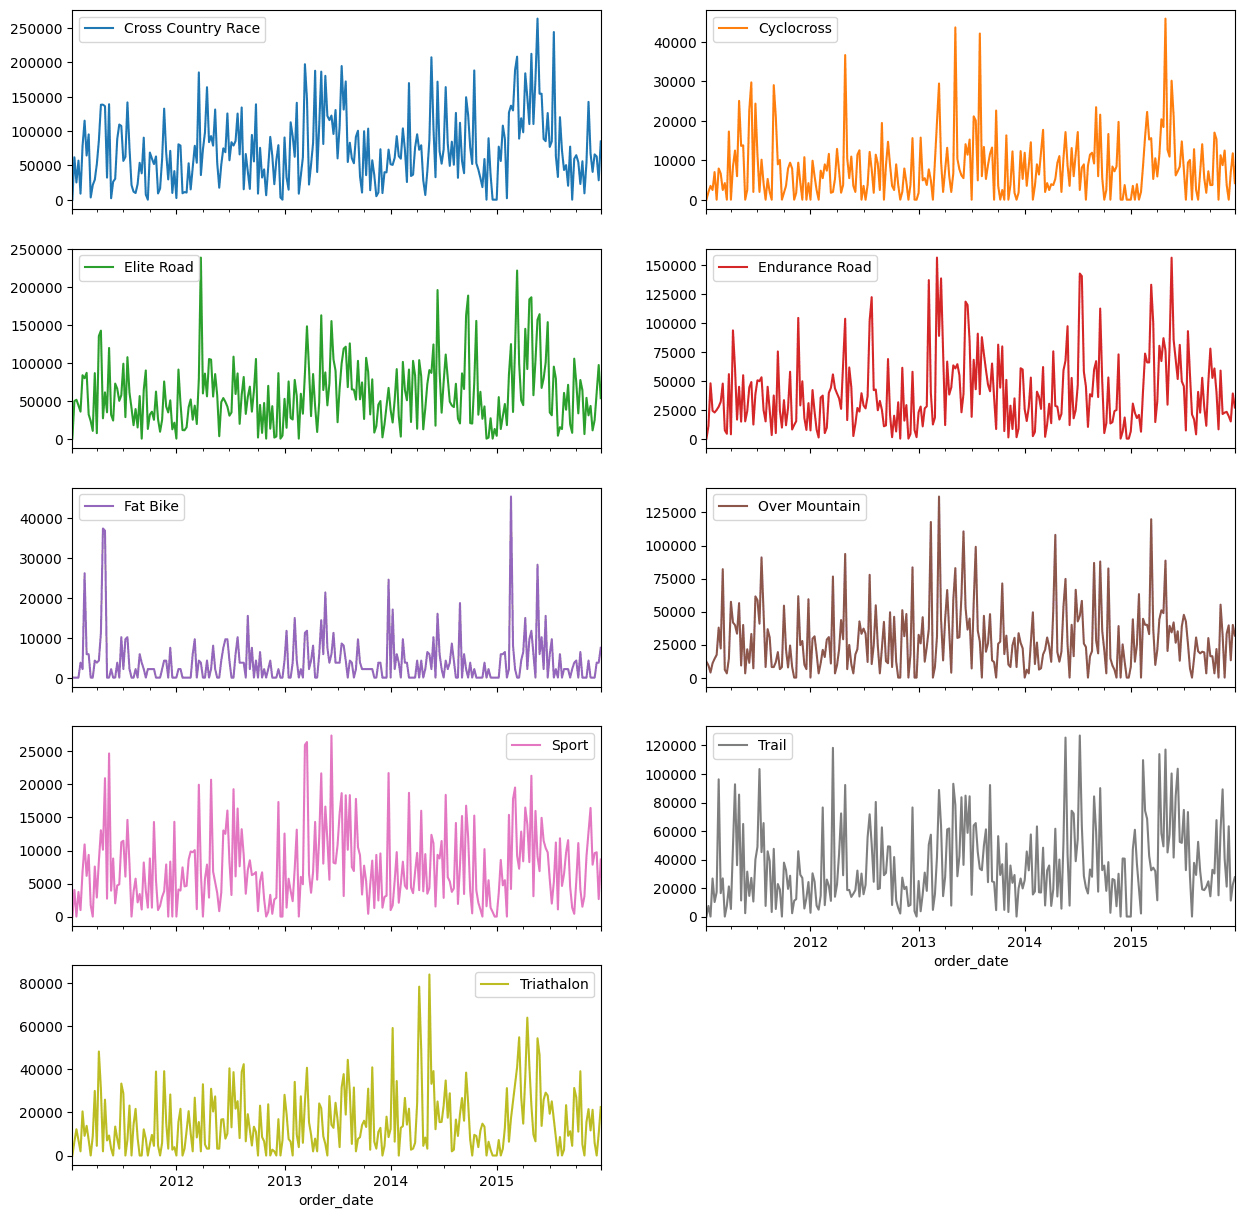
# 6.2 Weekly revenue for each sub-category
sales_by_level_week = df[['Category_2', 'order_date', 'total_revenue']] \
    .set_index('order_date') \
    .groupby('Category_2') \
    .resample("W") \
    .agg(np.sum) \
    .drop(columns='Category_2') \
    .reset_index()

# Long -> wide so each sub-category gets its own panel
sales_by_level_week \
    .pivot(
        index="order_date",
        columns="Category_2",
        values="total_revenue"
    ) \
    .fillna(0) \
    .plot(kind="line", subplots=True, layout=(5, 2), figsize=(15, 15))