Excel

Pivot tables, slicers, timelines and pivot charts on four business datasets, with the formulas behind them.

Does Caffeine Build Repeat Buyers?

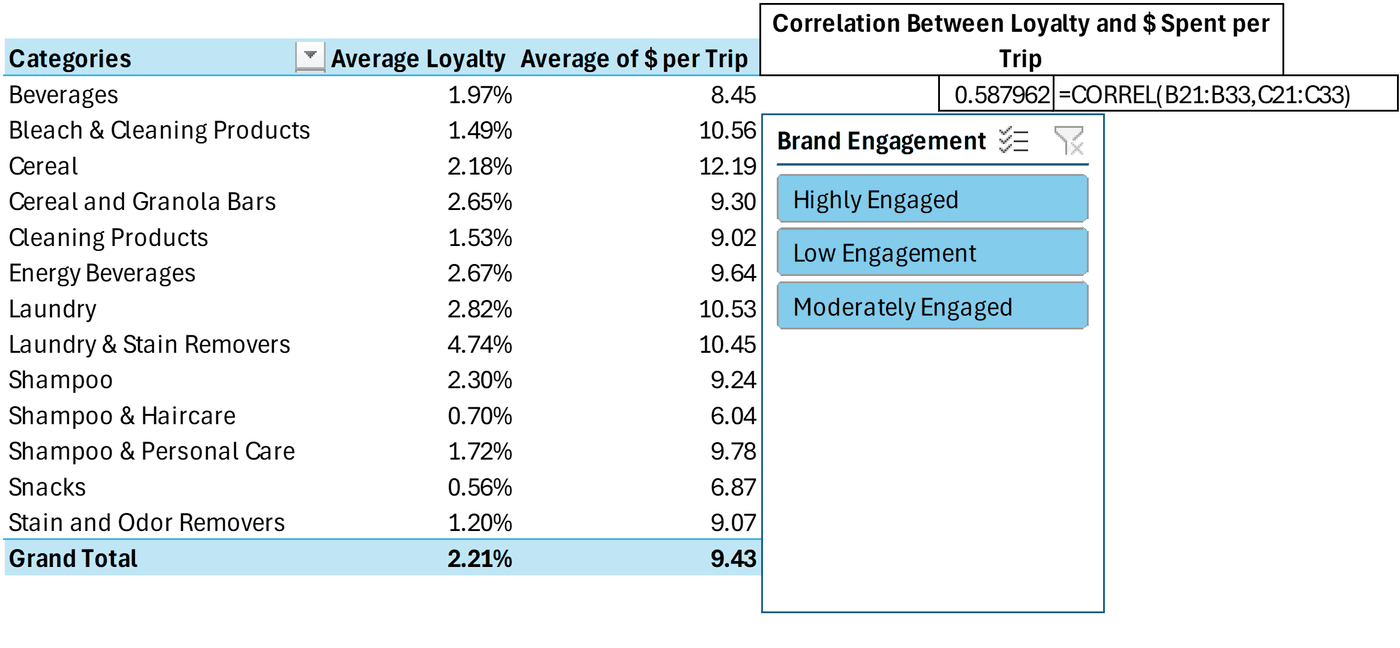
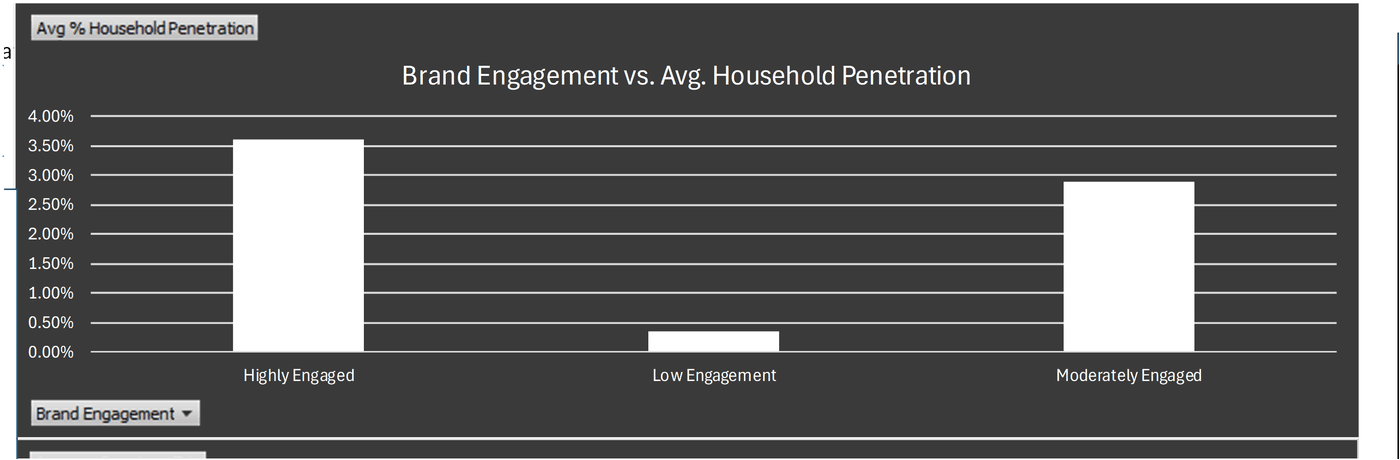
Household-panel data on consumer brands. Pivot tables with a Brand Engagement slicer compare categories, and a Welch t-test checks whether 29 caffeine brands earn more repeat buyers than 149 other brands.

r = 0.83household penetration vs repeat buyers
p = 0.19caffeine vs other brands: no significant difference
pivot tablesslicerspivot chartsCORRELT.TEST
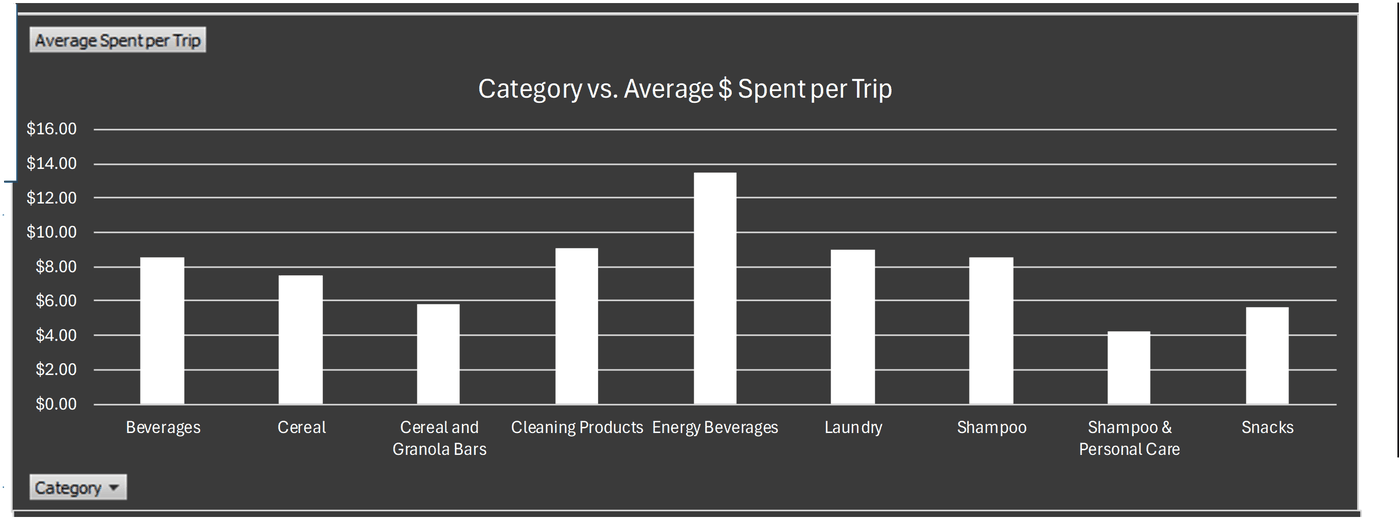
Pivot chart: brand engagement versus average household penetrationPivot chart: average dollars spent per trip by categoryPivot table of loyalty and spend per trip with a Brand Engagement slicer and CORREL result
More formulas · 6
CellFormulaReturns
E4=CORREL(B4:B16,C4:C16)0.8282
E21=CORREL(B21:B33,C21:C33)0.5880
L55=T.TEST(F51:F79,C90:C238,1,3)0.1789
E84=STDEV.S(E51:E79)0.1407
D87=COUNTIF(I51:I79,"Low Engagement")/COUNTA(I51:I79)10.3%
E2=D2/(1+F2)22.6% (prior-year penetration)

Amazon Orders by City

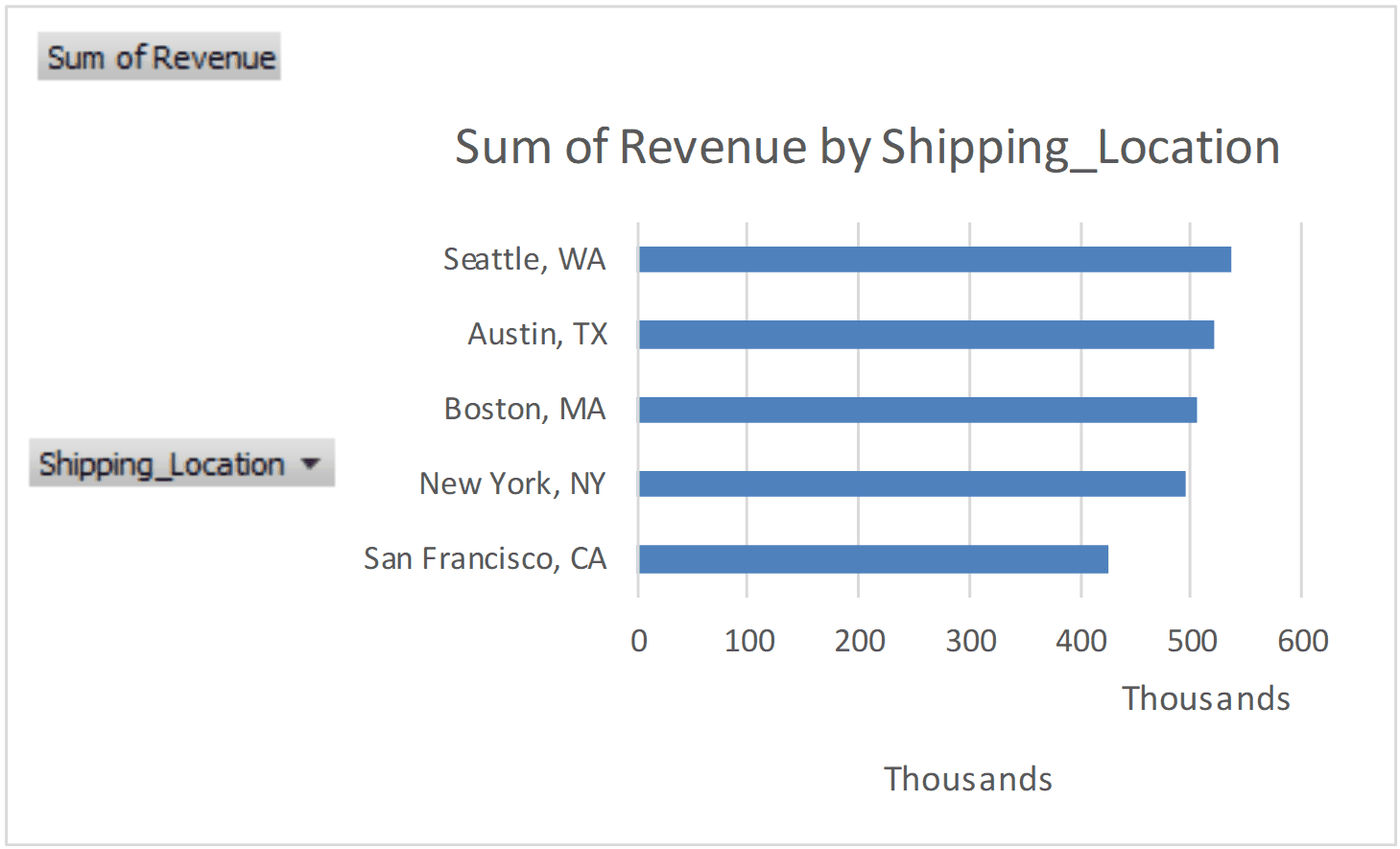
1,002 electronics orders in a structured table. A pivot chart ranks revenue by city, SUBTOTAL keeps totals right when the table is filtered, and a text formula flags orders shipped outside Washington.

$535KSeattle, the top revenue city
$1,014.52average price (filter-aware)
structured tablespivot chartSUBTOTALRIGHTSUMIF
Pivot chart: sum of revenue by shipping location in thousands
More formulas · 2
CellFormulaReturns
I1004=SUBTOTAL(109,Amazon_Orders[Quantity])2,453
M3=RIGHT(Amazon_Orders[[#This Row],[Shipping_Location]],2)="WA"=FALSEFALSE

Supplier Order Dashboard

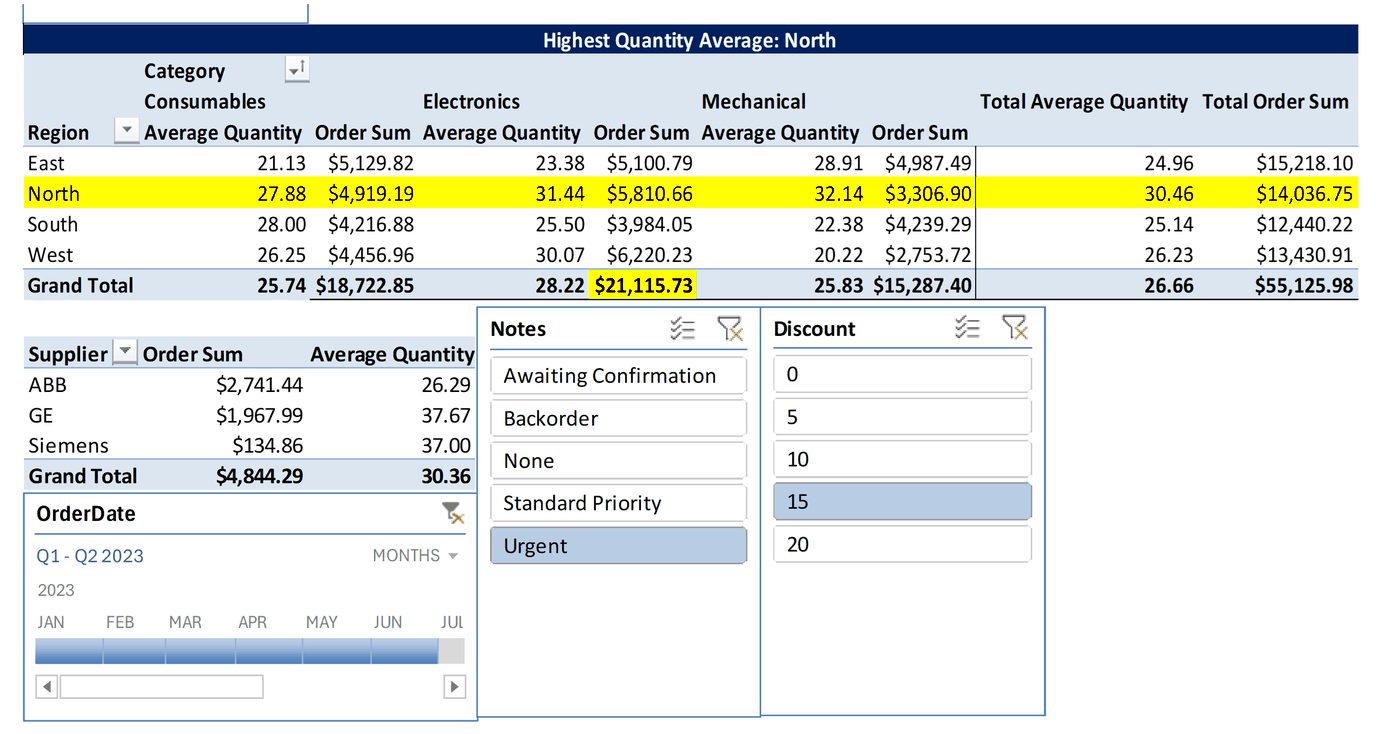
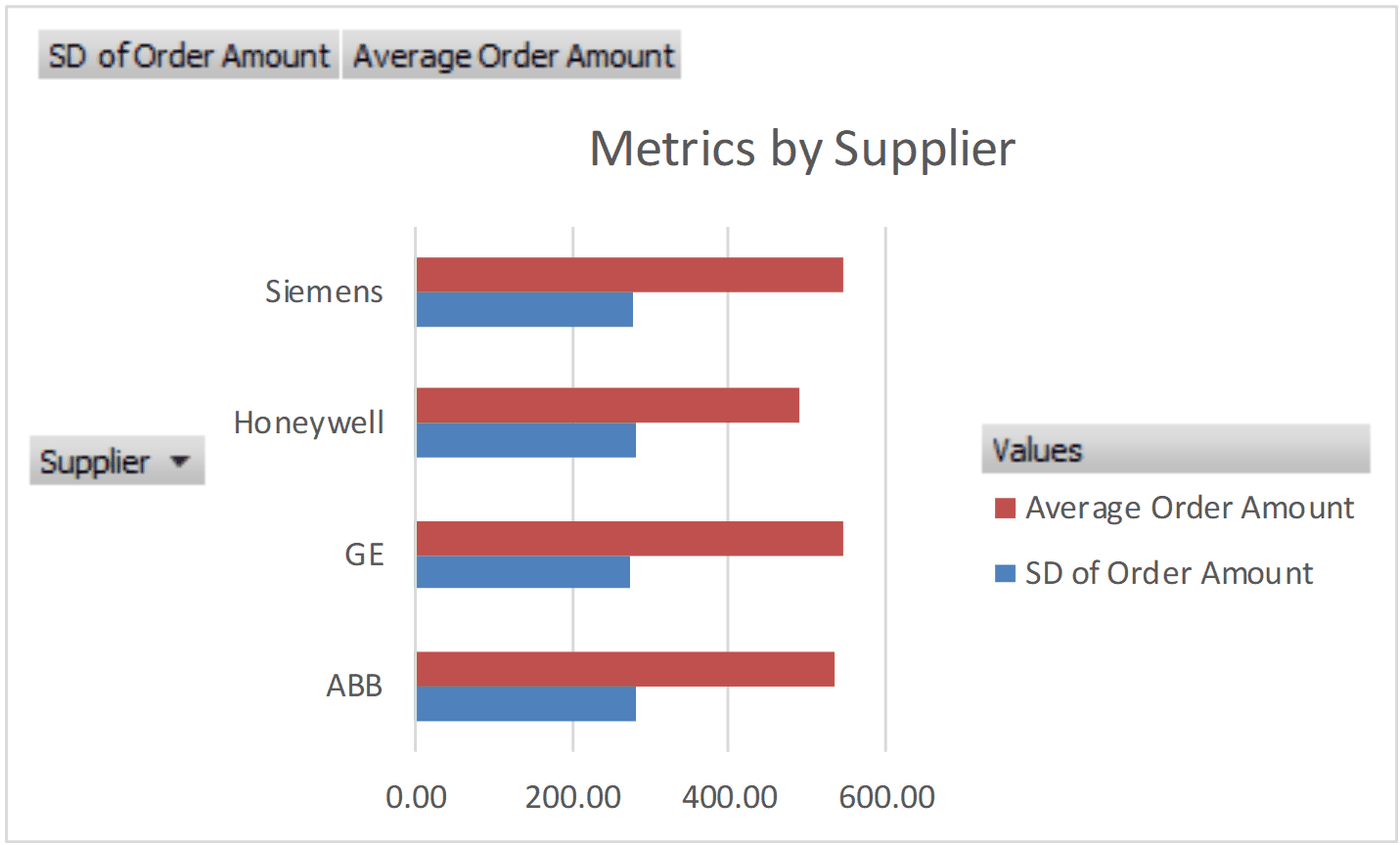
500 supplier orders. A pivot dashboard with Discount and Notes slicers and an order-date timeline highlights the top region, and a lookup finds the SKU behind the largest order. Bigger discounts did not bring bigger West orders.

r = -0.07discount vs order amount, West
SKU3248largest single order
timelineslicersconditional formattingXLOOKUPpivot chart
Pivot dashboard with highlighted top region, timeline and slicersPivot chart: average order amount and standard deviation by supplier
More formulas · 3
CellFormulaReturns
P1=XLOOKUP(MAX(Table14[OrderAmount]),Table14[OrderAmount],Table14[Cust_Rebate])10
I504=CORREL(G504:G525,H504:H525)-0.0655
G502=SUBTOTAL(101,Table1[OrderAmount])506.68

Insurance Policy Flags and Renewals

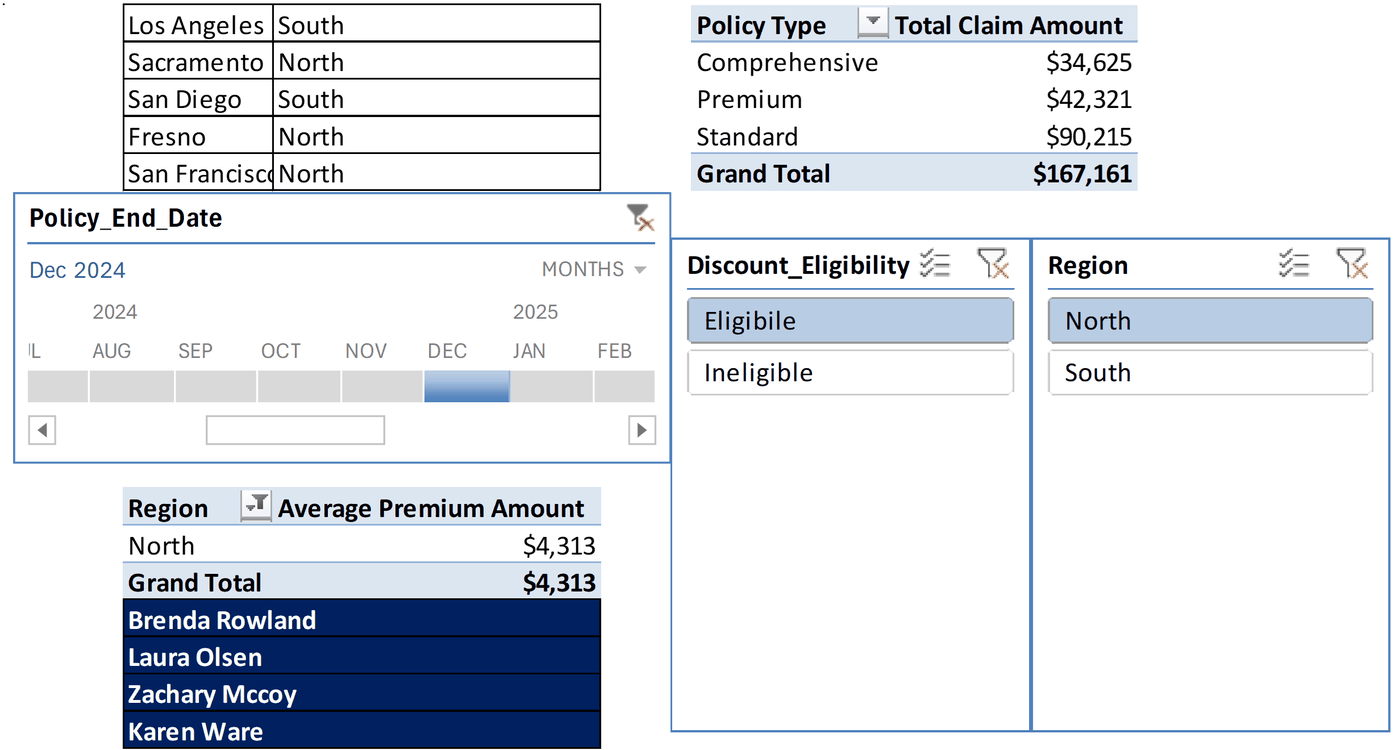
500 insurance policies. Row formulas flag special and high-risk policies, set renewal discount eligibility and map cities to regions. A timeline and slicers drive the renewal pivot.

41special policies flagged
69 of 500eligible for a renewal discount
IF / AND / ORAVERAGEIFSXLOOKUPCONVERTtimeline
Renewal pivot with Policy End Date timeline, Discount Eligibility and Region slicers
More formulas · 5
CellFormulaReturns
P3=IF(OR(Table1345[[#This Row],[Premium_Amount]]>4000,Table1345[[#This Row],[Claim_Amount]]>25000),"Yes","No")Yes
K2=AVERAGEIFS(K3:K501,E3:E501,"Comprehensive")2.43 (fills a missing claim count)
P2=XLOOKUP(Table134[[#This Row],[City]],$S$2:$S$6,$T$2:$T$6)South
Q4=XLOOKUP(Q3,Policy_ID,Premium_Amount)1,261
N2=CONVERT(M2,"m2","ft2")1,194.79

Foundations

Lookups, logic and text6 more formulas: INDEX/MATCH, wildcard XLOOKUP, IFS, SUMIFS, EOMONTH
TechniqueFormulaWhat it solves
XLOOKUP wildcard, fallback and reverse search=XLOOKUP(B48&"*",F43:F48,G43:G48,,2,1)Partial-text matches, a default when nothing is found, last match instead of first
INDEX / MATCH=INDEX(item_ranking_!B:B, MATCH($B$3, item_ranking_!F:F, 0))Look up a product name by UPC when the key column sits to the right
VLOOKUP inside IF=IF(D72="Y","No contact needed",VLOOKUP(B72,H72:J80,2,FALSE))Return a contact only when a record is missing a value
IFS tiered pricing=IFS(B13<500,B13*E$13,B13<=1000,B13*E$14,B13>1000,B13*E$15)Apply a different rate to each quantity bracket without nesting
COUNTIFS / SUMIFS=SUMIFS(Earnings,Department,B37,Earnings,">=100,000")Count cancelled orders by state; total earnings by department above a threshold
Dynamic report header="AS OF "&TEXT(EOMONTH(AB4,-1),"mmmm dd, yyyy")"AS OF" date that always shows the last day of the prior month